Financial Reports
1. Overview
This document provides an outline for configuring the Centrify 360 to cater for Business Central Financial Reports to be able to view these reports in Centrify 360.
Refer to https://learn.microsoft.com/en-us/dynamics365/business-central/bi-how-work-account-schedule for more info about Business Central Financial Reports.
2. Configuration Steps
2.1. Global Measures Definition
-
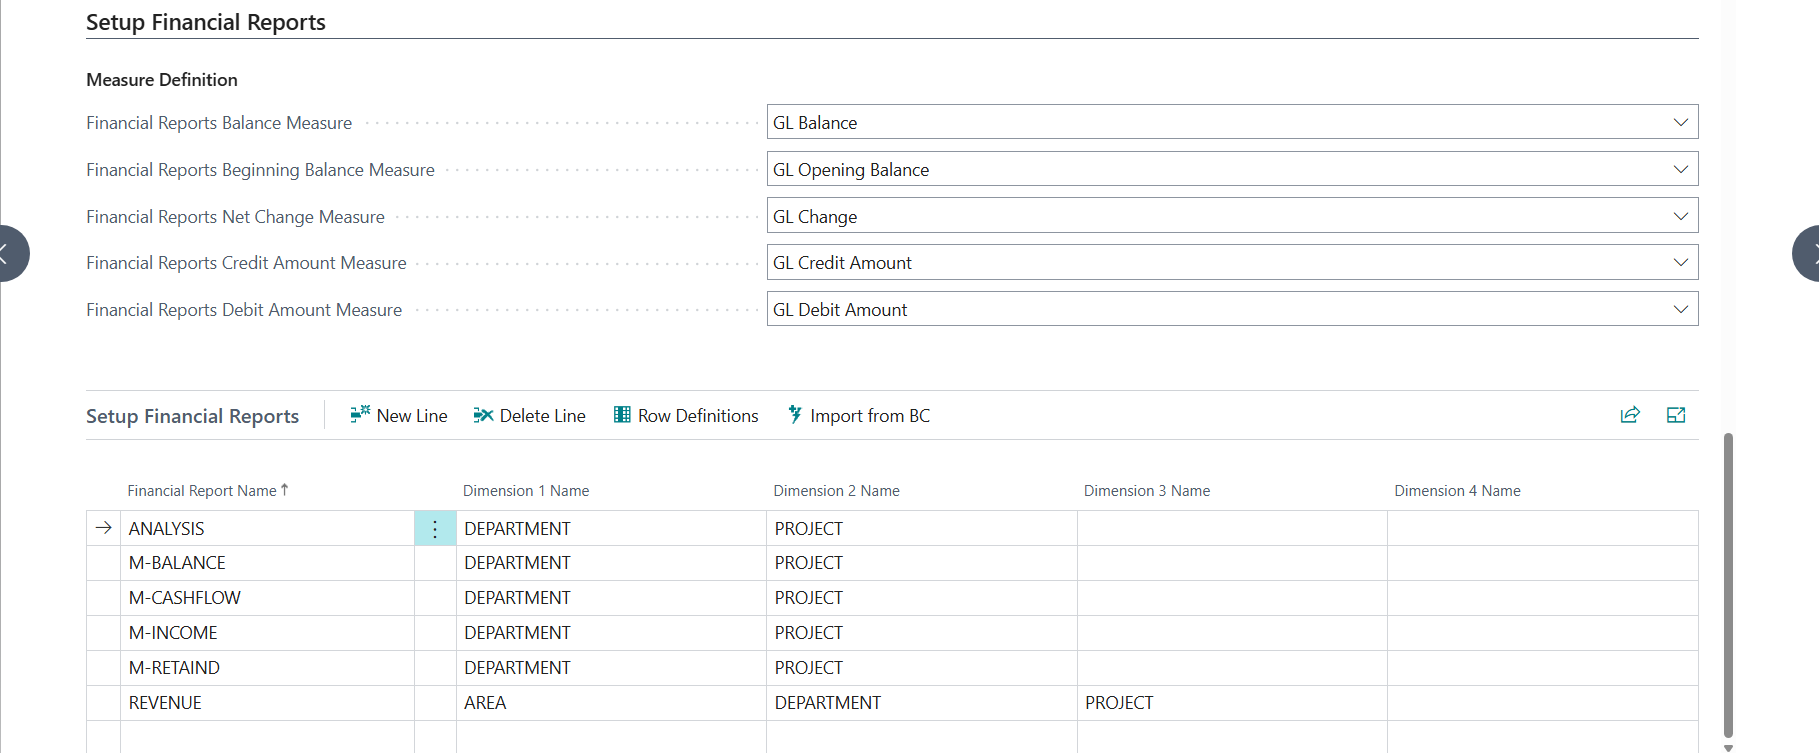
Navigate to Centrify 360 Setup page and focus on the Setup Financial Reports section:
-
Fill the measure definition for the 5 measures that impact the financial reports
The measures are already provided in the Standard Configuration as shown in the screenshot above-
Financial Reports Balance Measure: Will be mapped to row definitions with row type Balance At Date
-
Financial Reports Beginning Balance Measure: Will be mapped to row definitions with row type Beginning Balance
-
Financial Reports Net Change Measure: Will be mapped to row definitions with row type Net Change and amount type Net Amount
-
Financial Reports Credit Amount Measure: Will be mapped to row definitions with row type Net Change and amount type Credit Amount
-
Financial Reports Debit Amount Measure: Will be mapped to row definitions with row type Net Change and amount type Debit Amount
-
2.2. Financial Reports Definition
-
You can either create the financial report manually or import it from Business Central via the helper Import From BC button.
-
Import from BC can import multiple financial report definitions at a time.
-
Import from BC will import the current company definitions only (datasource specific overrides can be configured in a later step)
-
Import from BC will also map the dimensions required for the financial report (Based on Analysis View Name in BC)
-
-
Once you import the required financial reports, the result should look like the sample above:
-
Name: The financial report name to be shown in the views
-
Dimension x Name: Up to 4 dimensions (from preconfigured BI Dimensions) that specific row definitions may provide a filter on. Refer to https://learn.microsoft.com/en-us/dynamics365/business-central/bi-how-analyze-data-dimension for more info about analysis view names in BC.
-
2.2.1. Row Definitions
-
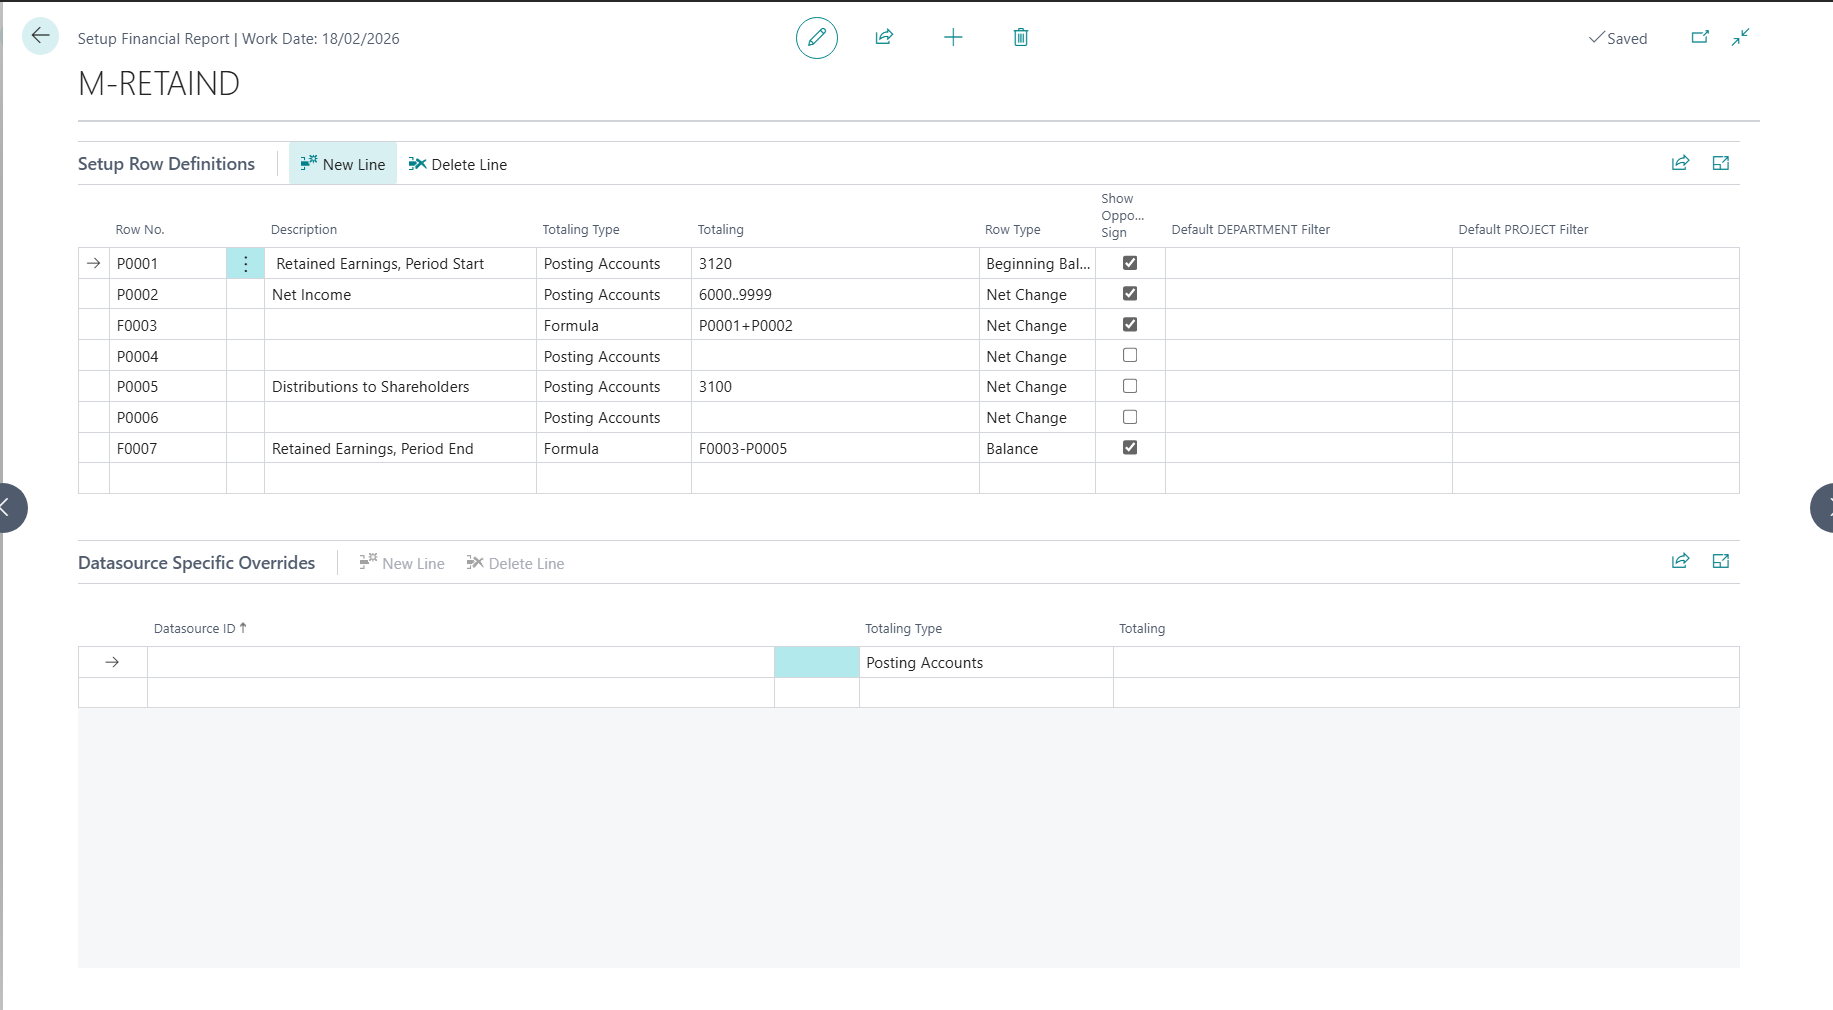
Press on the Row Definitions button to visualize the row definitions of a single financial report
-
The page is split into 2 components:
-
Global Row Definitons: This section includes the row definition that will apply to all datasources unless overriden in datasource overrides below.
-
Datasource Specific Overrides: For each row definition, you can override parts of the definition for a specific datasource.
-
-
Each row is defined by a set of attributes similar to BC row definitions:
-
Row No.: The row id which can be used in formulas later on
-
Description: The name of the row which will appear in financial reports in Power BI later on.
-
Totaling Type (Datasource Overridable): The type of totaling of the row, can be:
-
Posting Accounts: A set of G/L Accounts for which the row will calculate the measure for
-
Totaling Accounts: A set of Totaling G/L Accounts for which the row will calculate the measure for its totaling formula
-
Formula: A calculation between existing row ids
-
-
Totaling (Datasource Overridable): The formula or selection of posting/totaling accounts
-
Row Type: The row type (which measure should the row calculate):
-
Balance: The balance of the account
-
Beginning Balance: The beginning balance of the account
-
Net Change: The change in the account balance
-
Credit Amount: The credit changes in the account balance
-
Debit Amount: The debit changes in the account balance
-
-
Show Opposite Sign: Whether the row result should be shown in an opposite sign.
-
Default Dimension x Filter (Datasource Overridable): The filter of the dimension that should apply to the row calculation
-
2.3. Impact on Power BI Reports
A change in financial reports doesn’t require a redeploy of the configuration, but requires a regenration of the semantic model.
To achieve that, Click on Generate Semantic Model and a new model.bim file will be generated for you.
Add this model.bim file in your reports as mentioned in Basic Configuration for the new financial reports to be available.
Financial reports are mapped to semantic model calculation groups (Dynamic Dimension Table) and will be available to use as breakdowns in Power BI reports.
-
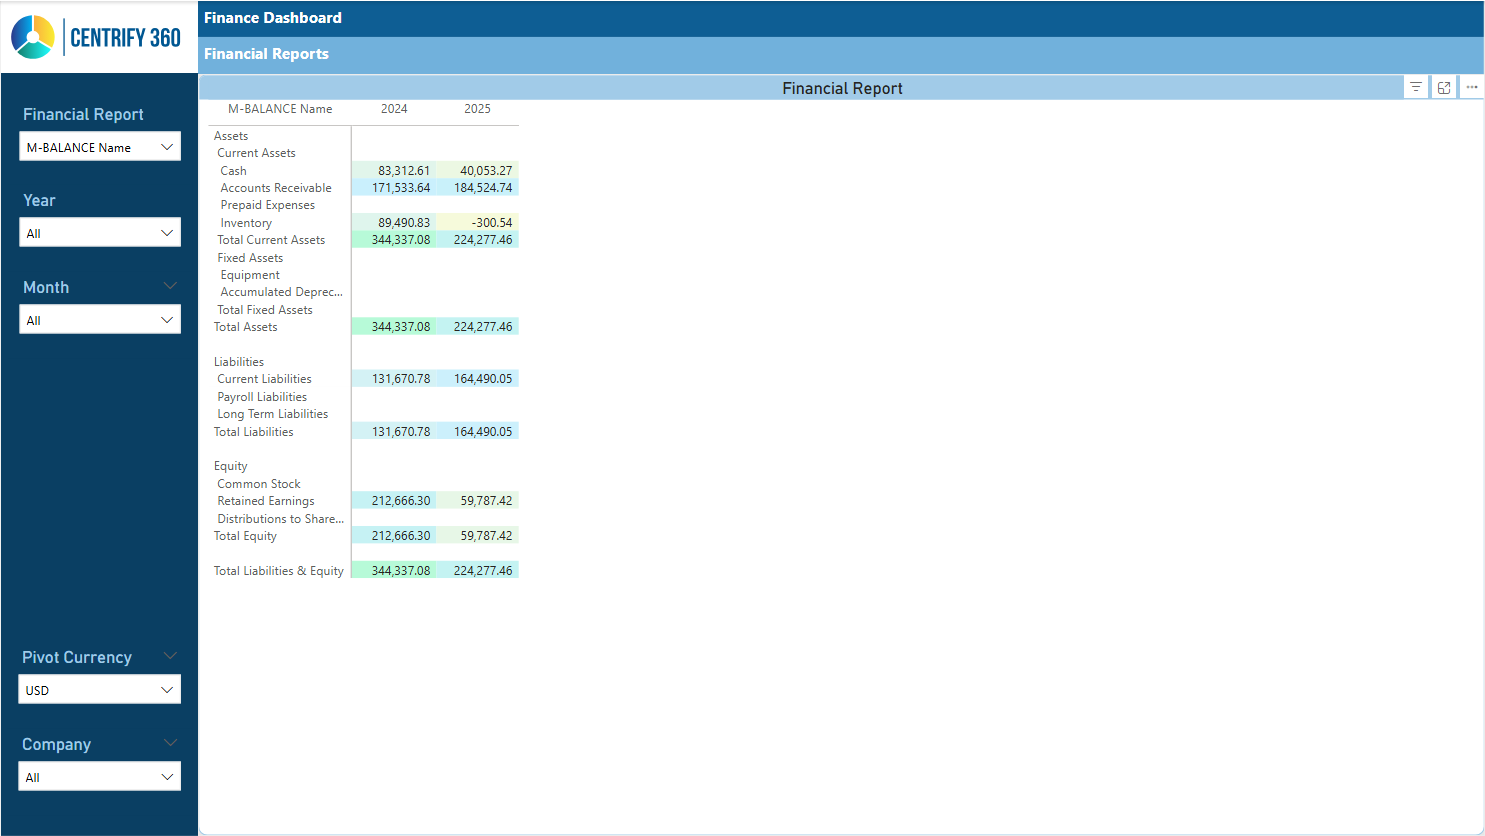
Open the Finance Power BI Report
-
Navigate to Financial Reports page
-
Select the Financial Report you would like to view from the slicer on the left
-
You should be able to see your report as defined, responds to filters and breakdowns (Can be viewed monthly, yearly, etc.)